Concepts of statistics are used frequently in GMAT maths questions, often in implicit ways. What we’ll cover in this article: Definition, formulas and solved / practice examples for concepts of mean, median, mode, range, standard deviation.
Introduction to Statistics
Meaning and Definition of Statistics
Statistics is the practice or science of collecting and analyzing numerical data in large quantities, especially for the purpose of inferring proportions in a whole from those in a representative sample.
(Reference : Oxford dictionary)
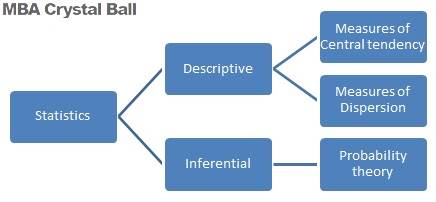
There are two categories in statistics:
1) Descriptive statistics
2) Inferential statistics.
From a GMAT perspective, our focus would be on some of the measures of descriptive statistics.
Descriptive statistics
Descriptive statistics is a summary of certain data, whose purpose is to give an overview.
Get instant access to our exclusive club →
The most commonly used example of this is the average, like the average marks obtained by a student in math in a period of 3 years.
Categories of Descriptive statistics
- Measures of Central tendency refer to a value that is usually the center point of a data set.
- Measures of Dispersion refer to how far the values in a data set have deviated from the mean value.
The following picture gives an easy way to understand whatever we have learnt till now.
Measures of Central Tendency
The most common measures of central tendency are mean, median and mode.
Mean
The Mean, also called the Arithmetic Mean or the Average, of a set of numbers is obtained by calculating the sum of all elements in the set divided by the number of elements in the set.
Formula for calculating the Mean / Average
Mean = Sum of the elements/Number of elements in the set.
Consider the following example:
Tom scored 88 in English, 97 in Math, 90 in Science and 85 in Social Studies. Calculate his average marks.
Solution: Average marks obtained by Tom = (88+97+90+85)/4 = 90.
Median
The Median of a data set is the middle value of the set when the elements are arranged in ascending or descending order.
When a data set has an odd number of elements, we choose the middle value.
When the data set has an even number of elements, the average or the mean of the two middle values becomes the median.
Consider the following examples:
1) Find the median of the set {4, 7, 1, 0, 9}.
Solution: Arranging the set in an order = {0, 1, 4, 7, 9}
4 is the median of this set.
2) Find the median of the set {3, 2, 5, 10, 8, 7}
Solution: Arranging the set in an order = {2, 3, 5, 7, 8, 10}
Median = (5+7)/2 = 6 is the median of this set.
Note:
When a set is evenly distributed, which means the difference between consecutive elements of the set is equal, the median and mean of the set are equal.
This can be verified with the help of an example.
Find the mean and median of the set {4,8,10,6}
Mean = (4+8+10+6)/4 = 28/4 = 7
Median = {4,6,8,10} = (6+8)/2 = 14/2 = 7
Mode
The Mode of a data set is the most frequently occurred value in the set.
A set may have more than one mode or no mode at all.
Consider the following examples:
1) 3, 4, 7, 3, 1, 2, 3, 9, 13
3 is the mode in this set.
2) 21, 34, 9, 57, 64, 34, 90, 9, 12, 2, 34, 9
This is a bimodal set. 34 and 9 are its modes.
3) 6, 7, 36, 2, 1, 41
This set has no mode.
Take a look at this example:
- The mean of 2,6,9,13,x is 9. Find the median of {22,x,38,11,5,9}.
Solution:
(2+6+9+13+x)/5 = 9
30+x = 5*9
X = 45-30 = 15.
For finding Median, arranging the numbers in an order,
{5,9,11,15,22,38}
The median is (11+15)/2 = 26/2 = 13
Measures of Dispersion
We will be focusing on two measures of Dispersion: Range and Standard deviation.
Range
This is probably the simplest measure of dispersion. It is obtained by calculating the difference between the highest and the least values of a set.
The range of the data set {3, 4, 10, 14, 8} is 14-3 = 11.
Standard deviation
The Standard deviation of a set is calculated in five steps.
- Calculate the arithmetic mean of the set.
- Find the difference between each value and the arithmetic mean.
- Square the differences of each value.
- Find the average of the squared differences. [The value obtained at this step is called the variance. Standard deviation is simply the square root of variance].
- Find the square root of the average.
Consider the following example:
Calculate the standard deviation for the set {3,4,7,10}.
Solution:
Arithmetic Mean of the set = (3+4+7+10)/2 = 24/2 = 12
| Each value in the set | Difference of each value and mean | Square of the difference |
| 3 | 12-3 = 9 | 81 |
| 4 | 12-4 = 8 | 64 |
| 7 | 12-7 = 5 | 25 |
| 10 | 12-10 = 2 | 4 |
Average of the differences = (81+64+25+4)/4 = 174/4 = 43.5 is the variance
SD = √variance = √43.5 = 6.595
Statistics Quiz: Sample questions to test your solving skills
Problem 1: Click here
Answer 1: Click here
Problem 2: Click here
Answer 2: Click here
Read GMAT vs CAT
