GE-McKinsey Matrix
In this article, we introduce the GE-McKinsey matrix and explain with an example how to make, plot and use it. We also compare it with the BCG matrix.
Definition and introduction
McKinsey itself provides a most lucid definition of the GE/McKinsey Matrix:
The GE-McKinsey nine-box matrix is a strategy tool that offers a systematic approach for the multi-business corporation to prioritize its investments among its business units.
In the 1970s, General Electric asked its consultants, McKinsey, to develop a portfolio management model that would suit it needs.
GE, which had about 150 business units under it at that time, had been using the BCG Matrix, but it had eventually felt the need for a more sophisticated framework to help it decide which of the units deserved development funds.
The result was what the business world would come to know as the GE/McKinsey Matrix, a strategy tool that helps a corporation decide whether or not to invest in one of its business units or products.
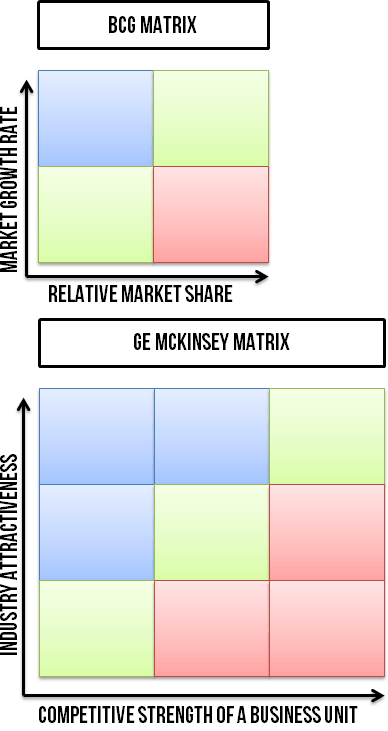
Like the BCG Matrix, the GE/McKinsey Matrix (“GE Matrix,” henceforth) today helps corporations make investment and disinvestment decisions related to their business units. But unlike the four-grid BCG Matrix, it has nine grids.
Moreover, while the BCG Matrix uses market growth and market share as its dimensions, the GE Matrix uses industry attractiveness and business unit strength as the criteria for its measurements.
If you know how the BCG Matrix works, the following illustration will help you to quickly compare the two matrices.
A corporation can plot its business units (or products) on the GE Matrix on the basis of the attractiveness of the industry concerned and the competitive strength of the units.
Credit: strategicmanagementinsight.com
GE-McKinsey Matrix explained with an example
The McKinsey Matrix, because of its higher sophistication, is a little more difficult than the BCG Matrix to put into practice. But one can learn to use it by following the five steps given below. Based on the template format introduced earlier, here’s how you can make & use it.
Imagine that we are plotting just two business units, Business Unit A and B, on the GE Matrix.
Step 1. Determine the industry attractiveness of each business unit
List the factors: To determine industry attractiveness, the following are among factors taken into consideration: the industry growth rate, market size, industry profitability, low competition, and PEST factors.
Decide weights: To keep it simple, let us take just three of the factors that make an industry attractive for investments: High profit, industry growth, and low competition.
Now, we need to decide the weight of each factor—that is, how important each factor is—by giving it points from 1 (not important) to 10 (very important).
The total of all the weights should be 10. Let us assume that high profit is the most important of the factors; if so, give it a weight of, say, 5 out of 10.
Give industry growth 3 out of 10, and low competition 2 out of 10 (these are just random weights, given only for example).
So, this means that the possibility of making a high profit is the most important consideration in entering the market, followed by market growth and low competition.
Rate the factors: Now, rate each factor for each business unit on a scale of 1 (not attractive) to 10 (very attractive). Let us say that for Unit A, low competition is the most attractive factor.
If so, it is put at 6 (for example) on the scale. Industry growth and high profit get scores of 4 and 1, respectively, for Unit A. For Unit B, industry growth scores 3, high profit 6, and low competition 1 (the ratings need not add up to 10).
Weighted score: To get the weighted score for each factor of industry attractiveness, we multiply the weight of the factor by the rate for the unit. Here are the weighted scores for Unit A and Unit B.
Unit A: Low competition: 2 (weight) x 6 (rate) = 12. Industry growth: 3 x 4 = 12. High profit: 5 x 1 = 5. Total weighted score for Unit A = 12 + 12 + 5 = 29.
Unit B: Low competition: 2 x 1 = 2. Industry growth: 3 x 3 = 9. High profit: 5 x 6 = 30. Total weighted score for Unit B = 2+ 9 + 30 = 41.
Step 2. Determine the competitive strength of each business unit
Step 2 is similar to Step 1, but instead of industry attractiveness, we try to find out the competitive strengths of Units A and B.
List the factors: To determine the competitive strengths of Units A and B, the following are among the factors that can be taken into consideration: market share, growth rate, profitability, brand reputation, and customer service.
Decide weights: For simplicity’s sake, let us take into account only three factors here: market share, profitability of the unit, and brand reputation.
As in the case of industry attractiveness above, we need to decide the weight of each factor—that is, how important each factor is—on a scale from 1 (not important) to 10 (very important).
Say, market share is the most important factor, so give it 5 out of 10. Give profitability 3 out of 10, and brand reputation 2 out of 10 (the weights must add up to 10).
So, this means that, in this example, market share is being considered as the most important factor in evaluating the relative strengths of the two units.
Rate the factors: Now, as above, rate each factor for each business unit on a scale of 1 (not important) to 10 (very important factor).
Let us imagine that for Unit A, brand reputation is the strongest factor, and gets 5 out of 10. Market share and profitability score 1 each for Unit A.
For Unit B, market share gets a score of 3, profitability 6, and brand reputation 1 (the ratings need not add up to 10).
Weighted score: To get the weighted score for each factor of competitive strength for each unit, we multiply the weight for the factor by the rate for the unit. Here are the weighted scores for Unit A and Unit B.
Unit A: 1. Brand reputation: 2 (weight) x 5 (rate) = 10. Market share: 5 x 1 = 5. Profitability: 3 x 1 = 3. Total weighted score = 10+ 5+ 3 = 18.
Unit B: Brand reputation: 2 x 1 = 2. Market share: 5 x 3 = 15. Profitability: 3 x 6 = 18. Total weighted score: 2 + 15 + 18 = 35.
Step 3. Determine the position of the units on the matrix
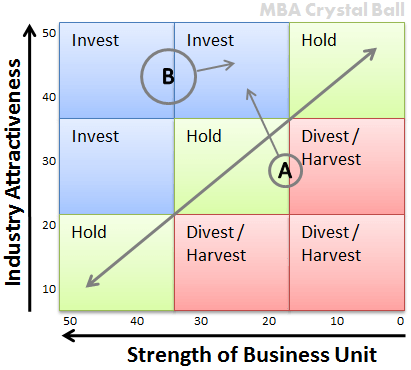
Once we have the weighted scores of the units, we can plot the units on the matrix. Here, in the example, Unit A and Unit B score 29 and 41 in industry attractiveness, and 18 and 35 in unit strength, respectively.
Each unit is represented by a circle with its size showing the unit’s market size. A pie chart can also be shown on the circle showing its market share.
Generally, unit that are above the diagonal of the matrix would be candidates for additional investments and those below candidates for divestment.
Units that fall on or about the diagonal are usually put in the “hold” category. A dimension showing the outlook for the units can also be included, and it is explained in Step 5.
Step 4. Determine the strategy option for the units
Depending on the position of the unit on the matrix and the box on the matrix in which it has been placed, three categories of investment or divestment decisions can be made: (1) invest; (2) hold; (3) harvest or divest.
Corporations are advised to make resources available to units in the “invest” category, as they promise high returns in the future. As for the “hold” category of units, corporations may invest in them only if they appear to have a future and if resources are available to the corporation after investments have been made in the units in the “invest” category.
Corporations are advised to harvest or divest units in the “harvest/divest” category” if they are not showing any promise. If these units are still generating cash, this revenue can be used to fund the promising units.
Units that are making losses and those for which a turnaround plan is not feasible should be divested.
In the example of the two units above, Unit A is in the “hold” category, and Unit B is in the “invest” category.
Step 5. Forecast the future of the units
The wisdom of business analysts is necessary to predict the outlook for any industry. For example, the matrix shows that Unit B is in the invest category.
However, if the outlook for its industry shows that the market is likely to shrink and it might lose strength, Unit B would become much less attractive for investment.
On the other hand, if the future scenario for Unit A shows that its industry is poised for growth, the unit, now placed in the “hold” category by the matrix, will become attractive for investment.
GE-McKinsey Matrix vs. BCG Matrix
The main advantage of the GE Matrix as a strategy tool is, of course, that it tries to answer the question of where scarce resources should be invested.
It is more refined than the BCG Matrix as it replaces a single factor, “market growth,” with many factors under “market attractiveness.”
Similarly, competitive strength of a business unit in the GE Matrix includes many more factors than just market share, as seen above.
But, like the BCG Matrix, the GE Matrix also fails to consider interdependencies between business units under one corporation and their core competencies.
Another disadvantage of the GE Matrix is that preparing it is a complicated exercise that probably demands the expertise of a consultant.
Found this lesson useful? You’re going to love our online Mini MBA certificate course. It covers other important strategy concepts (including powerful frameworks), as well as the wider range of super-essential business topics.