BCG Growth-Share Matrix
Introduction
The BCG Growth Share Matrix was evolved in the early 1970s by Bruce Henderson, founder of the Boston Consulting Group, to help corporations make investment and disinvestment decisions related to their business units or product portfolios.
The advantages of the BCG growth share matrix are manifold.
It plots business units (or products) that form part of a corporation’s portfolio on a grid of four equal quadrants on the basis of their market growth and market share (which is why the BCG Matrix is also called the “Growth-Share” Matrix).
The matrix categorises business units as “stars,” “cash cows,” “dogs,” and “question marks,” depending on whether they deserve cash infusions or need to be closed down.
The management team can then decide on the right business strategy for each unit.
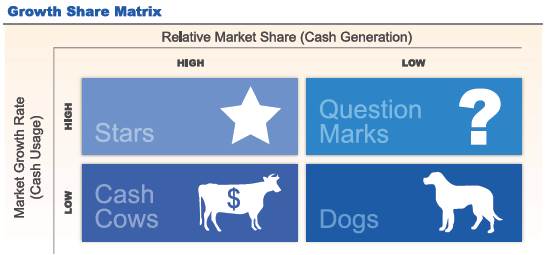
Image Credit: constructionmarketingassociation.org
The quadrants of the BCG Growth Share Matrix
Let us study the four categories identified in the BCG matrix and how they can be used to decide on the appropriate business strategies.
Stars
“Stars” are business units that have a high market share but consume a high amount of cash as they are situated in a high-growth market.
Companies that are the first to enter a market and monopolies are described as “stars.” Stars generate cash because of their high market share, but because a high-growth market also demands cash, most of the cash that stars earn is absorbed by their capacity-building activities.
Stars may become “cash cows” if they can maintain their market share until the market itself stars to decline.
BCG Matrix Stars Strategy:
Invest in stars in the hope that they become cash cows and generate funds for the corporation’s future plans.
Cash cows
“Cash cows” are business units with a high market share but find themselves in a mature, low-growth market.
Therefore, such units do not require cash but rather provide cash.
Cash cows can be “milked” to generate funds for other business units under the corporation, to turn “question marks” into “stars,” to repay corporate debt, to issue dividend to share holders, or to fund research.
BCG Matrix Cash Cows Strategy:
Invest in cash cows, but only to maintain their level of productivity, and until they become “dogs.”
Dogs
Dogs, also known as “pets,” have a low market share in a low-growth market. They neither generate cash nor require investments. They are often seen as “cash traps,” in which the investments already made do not generate profits.
BCG Matrix Dogs Strategy:
Sell them off.
Question marks
Question marks, also known as “problem children,” have small growth rates in a high-growth market. They demand high investments to capture some market share, but whether this cash infusion will provide returns will be known only in the future. However, they have the potential for growth.
BCG Matrix Question Marks Strategy:
Invest in them depending on the prospects, but sell them off if they do not start yielding profits.
Applying the matrix principles, all business units start off as question marks, then become stars and cows, and finally end their life cycles as dogs.
Examples of BCG Matrix
An experimental BCG Matrix on Maruti Suzuki by academics in 2013 (available online) showed the company’s Swift Desire and Zen Estilo as the stars in its product portfolio, the Alto and Wagon R as the cash cows, the Baleno and Versa as the dogs, and the Maruti SX4 and Grand Vitara as the question marks.
A similar academic exercise on the portfolio of the Tata Group in 2012 identified Tata Steel, Tata Motors, and Indian Hotels as the stars; Tata Tea, Tata Power, and the chemicals businesses as the cash cows; and Voltas and Tata Communications as the question marks. Tata Housing was placed in the dogs category.
Henderson’s matrix makes two major assumptions:
- The higher the relative market share, the higher the cash generated by the unit. (This assumption is often true—when a firm captures a higher relative market share, it goes forward on the experience curve compared with its rivals, and secures a competitive advantage and a cost advantage.)
- The higher the market growth, the higher is the requirement of cash for capacity-building.
It is on the basis of these assumptions that the categorisation of business units as stars, cash cows, dogs, and question marks was envisaged. A business unit’s position on the matrix indicates how much cash it generates and consumes. A corporation can find out the relative positions of all its business units under it from the matrix.
Apart from assisting in decision-making on the allocation of funds among different business units, the BCG Matrix can help a corporation decide on earmarking funds for the development of its products. The matrix can also be used to calculate the relative market share and the market growth of a product line. It can also show the position of a business unit or product in its life cycle.
Criticism of the BCG Matrix
The BCG Matrix has lost some of its popularity following the development of other models, and drawn criticism for its basic assumption that a business unit with a higher market share will generate more cash. It has been pointed out that a unit that has a high market share needs to keep investing in itself to sustain this share and, therefore, may absorb cash instead of generating it.
Also, the matrix seems to ignore interdependencies among a corporation’s business units. A dog, for example, may be helping a question mark or a star with cash.
The matrix also seems to use broad definitions of market share and market growth overlooking nuances—a unit that makes moped tyres, for instance, may have a big market share in this niche segment, but only a minuscule share of the overall tyre market. The corporation that owns this unit may be using it as a cash cow for the benefit of a “star” or a “question mark” in its portfolio.
The matrix has also been criticised for suggesting that all corporations will identify units or products in the four quadrants, and that units or products will travel through all the four quadrants in their life cycles.
Finally, market growth rate is only one factor that makes an industry attractive. Similarly, relative market share is only one factor that gives a unit a competitive advantage. According to critics, the matrix ignores other factors that determine profitability. At least some critics suggest the use of the GE/McKinsey Matrix.
BCG’s response: Matrix 2.0
In a paper published in 2014, the BCG, while defending the basic principles of the matrix, acknowledges that the business world and the distribution of companies across the matrix have changed.
It recommends “strategic experimentation [with the original matrix] to allow adaptation to an increasingly unpredictable business environment.”
The full paper can be seen at this link.
The paper admits that in the modern business environment, the matrix needs “a new measure of competitiveness to replace its horizontal axis,” as market share cannot be relied upon as a strong pointer to performance anymore.
It says companies need to look at new markets and products to renew their advantage and desist from wasting resources. They need to invest in more question marks to help the promising ones grow into stars.
Responding to the marketplace, they should also cash out stars, retire cows, and maximize the information value of pets.
The BCG gives the example of Google, with its portfolio of AdWords, AdSense, Android, and other products, and says that at that company, portfolio management is “embedded in organizational abilities that facilitate strategic experimentation.”
At Google, questions marks are generated, and a few are selected and tried out before they are scaled up.
Making suggestions for using “BCG Matrix 2.0,” the paper puts forward “four practical imperatives” that businesses can use in strategic experimentation.
Found this lesson useful? You’re going to love our online Mini MBA certificate course. It covers other important strategy concepts (including powerful frameworks), as well as the wider range of super-essential business topics.