Introduction to Balance Sheets
Every business, regardless of its size and nature, is legally obliged to keep accounts. It must have an organized system to communicate its financial health and this usually comprises of the balance sheet, the income or profit and loss statement and the cash flow statement.
- The income statement or profit and loss account shows the business’s profits and losses
- The balance sheet reports its financial position on the last day of the profit period
- The cash flow statement reports how much cash was generated from profits and other sources during that period and how the business used it.
Together these reports support each other and enable the business record, classify and report information about the business.
Understanding the balance sheet is a key management skill. It shows what the business can leverage with its investors. The person drawing it up must make several judgments related to monetary values. More than the accounting figures, the criteria used is important, as are the dates.
What is a balance sheet?
The balance sheet helps analyse a business’s liquidity and leverage. It shows the financial state of the business at a specific point in time and carries details of the assets, liabilities and equity as on a particular date. Simply stated, for a specific date, it shows:
- What the business owns = assets (monetary resources that result in economic benefits)
- What the business owes = liabilities (debts, loans, etc.)
- Value to its stakeholders = equity or net worth (value after liabilities are met, which is money invested plus profits earned and reinvested in the business)
A balance sheet represents the basic accounting equation:
Total assets = Stakeholders’ equity + Total liabilities
Each of these items are categorized into several accounts that represent the value of that item. For example, cash, inventory, property come under Assets. Accounts payable and debts come under Liabilities.
How to prepare a balance sheet
A balance sheet is prepared at the end of an accounting period and reveals the business’ financial status showing its asset value, its liabilities and its investments as on the date on which it is prepared.
You don’t have to be a financial whiz to understand a balance sheet. In its simplest form, it can be a two-column layout.
Balance Sheet Format
After stripping away all the details, here is what the standard balance sheet format looks like.
| Left Hand Side (Assets) | Right Hand Side (Liabilities & Stockholders’ Equity) |
|---|---|
| Current Assets – cash, accounts receivable, and other assets that are ‘liquid‘ i.e can be converted to cash fast. | Current Liabilities – the company’s liabilities that are due in the next year. |
| Property & Equipment – plus long term operating assets (less the asset depreciation). | Long-term Liabilities – debt not maturing in the next year, e.g. bonds. |
| Other Assets – general stuff that doesn’t fit in the above slots | Stockholders’ Equity – a breakup of of how the remainder of the company’s assets are financed, e.g. stock (common / preferred) and retained earnings. |
| Goodwill – the excess of the purchase price over the fair market value of an asset. |
At the top of the balance sheet, the name of the company and ending date for the accounting period are recorded. Assets are always on the left side and liabilities and equity are on the right. The total value is the same for each side, which means the left column must always be in balance with the right side.
The balance sheet format can also be in the form of a report where Assets are listed followed by Liabilities.
The balance sheet contains a summary of the following:
- Assets: Everything the business owns of value and this includes tangible and intangible assets. Tangible assets include cash, property, land, plant and machinery, vehicles and furniture while intangible assets include accounts receivable (money owed to the business).
- Debts and liabilities: The money owed by the business to suppliers, staff wages
- Equity: Cash invested in the business by its owners and stock holders including issued capital and reserves.
The reason it’s called a balance sheet is that both the sides balance. The basic balance sheet equation is:
Balance sheets of large companies can appear complex but when you learn the basics, it is quite logical. All balance sheets follow a standard format which makes them easy to compare.
Sample Balance Sheet Format
Here is an example of a sample balance sheet format.
Image Source: wordtemplatesonline.com
A brief description of the entries:
Total assets:
Current Assets
– which can be converted to cash, sold for money or used within the accounting year.These provide the primary source of working capital for the business and include
- Cash in the bank, petty cash and cash reserves – savings accounts, bank certificates, and other short term investments reported at present market value on the reporting date.
- Short term investments: including equity and debt securities that are marketable within the accounting period, reported at market value.
- Accounts receivable: Money due to the company for its products and services by customers who have bought on credit, which are likely to be received during the accounting period.
- Notes receivable or short term loans with interest with a provision for bad debt
- Inventory: raw materials, production in progress andfinished goods
- Prepaid expenses: Payments made in advance for services due including rent, insurance premiums and taxes valued at their original cost.
Fixed assets
– or physical tangible assets that include buildings, plant and machinery, vehicles and other office equipment the business needs in its operations.Fixed assets also include intangible assets such as patents, franchises, copyrights, goodwill, trademarks and brand names.
The cost of fixed assets is reported minus depreciation to show the economic cost of the assets which are not sources of cash flow. An asset’s value depreciates over time and in the accounting context, businesses must depreciate their assets gradually and deduct the amount from the total value of their fixed assets. This is usually mentioned after the original cost of the asset in order to show its net value. Regardless of their market value, property and equipment and depreciation are showed in cost even if market value is less than the cost of purchase.
Other assets
This includes items that do not fit elsewhere and include long term investments and advance payments.
Total Liabilities
Liabilities include loans, accounts payable, mortgages, deferred revenue and accrued expenses. In the balance sheet they are listed as current liabilities, long term liabilities and equity.
Items that are due or need to be paid within a year are current liabilities, while those that are due after 12 months from the date of the balance sheet are long term liabilities.
- Current liabilities include wages, taxes, accounts payable, rents, bank line of credit, accrued liabilities, short term loans, current portion of a long term debt. Accounts payable include unpaid bills from suppliers and other service providers. Accrued payroll is the amount owed to staff.
- Long term liabilitiesinclude debts and other non-debt financial liabilities like long term product warranties, long term leases, notes payable, bonds and pension dues due after 12 months from the date of the balance sheet.
Then there is long term debt that caters to the financing needs of the business. The portion of this loan due within the next year is reported under current liabilities
Equity
This is the difference between the total assets and total liabilities and is usually an indicator of the net worth of the business. This will include loans from shareholders (money invested), capital stock, capital contributions and retained earnings.
If the net earnings after taxes are reinvested into the business, the retained earnings feature in the balance sheet in the shareholders’ equity account.
Balance sheet analysis
Now that we know the standard balance sheet format and how it is prepared, let’s look at balance sheet analysis. As mentioned earlier, regardless of what balance sheet format is followed – two columns where assets are on the left, liabilities are on the right and net worth is beneath liabilities, or one column where assets are listed first followed by liabilities and net worth – all contain the same information.
Balance sheets can be used to gauge how efficiently the business is being managed. It also shows a business’s liquidity and solvency, in addition to how its intangible assets compare to its tangible ones and answers the following questions:
- Is the business ready for expansion?
- Can it handle fluctuations in revenues and expenses?
- Does it need cash?
- Does the receivables cycle need adjustment?
- Are there bad debts?
Financial ratios help to convert the data in the balance sheet into information that helps manage the business and make informed decisions.There are four important financial ratios:
- Working Capital
- Current Ratio
- Quick Ratio
- Debt/Worth Ratio
Balance Sheet Example
Here is a balance sheet example that we’ll use for a sample balance sheet analysis.
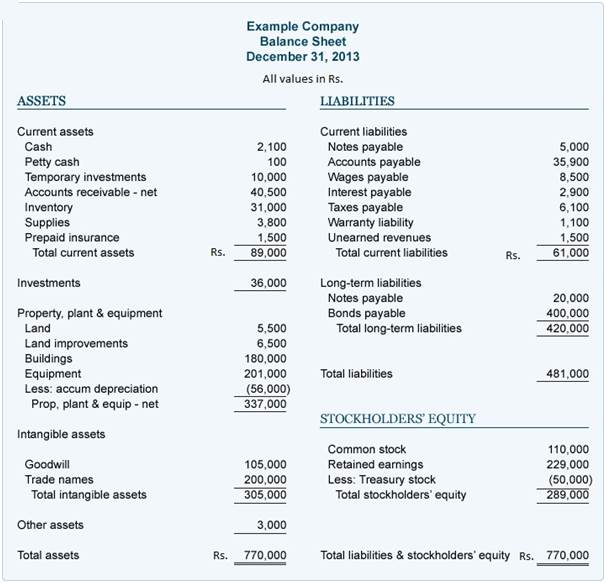
Image Source: accountingcoach.com
This balance sheet reports the company’s assets, liabilities and equity as on December 31, 2013.
Financial ratios based on this balance sheet analysis
(All values in rupees)
Working Capital
= Current assets – current liabilities
= 89,000 – 61,000
= 28,000
This shows the ability of the company to meet its present commitments such as bills to be paid, loan payments etc. If the current assets are identical to current liabilities, there is no working capital. The higher the working capital amount, the better its chances of making payments on time.
Ratio Analysis notes:
Working capital should always be a “+” as lenders use it to assess the company’s ability to survive in tough times. Loan agreements usually mandate that the borrower must maintain a working capital level of working capital to qualify for the loan.
Current Ratio
= Current Assets / Current Liabilities
= 89,000 / 61,000
= 1.46
This shows the relationship between current assets and current liabilities. If the ratio is 1 : 1, there is zero working capital. If it is 3:1, it is good.
Ratio Analysis notes:
The current ratio, also called the liquidity ratio assesses the company’s financial strength and its solvency is expressed by the number of times current assets exceed current liabilities. Current ratio provides the answer to the question: Does the business hold sufficient current assets to meet current liabilities with a safety margin? A good benchmark for the current ratio is 2, subject to the nature of the business and its assets and liabilities. While debts due are clear enough, the quality of accounts receivable and cash value of inventory are always fluid. Current ratio can be improved by raising current assets and lower liabilities and some tips to do this are:
- Paying off debts,
- Getting a loan that is payable after a year
- Selling a fixed asset
- Reinvesting profits back into the business
Thus, a high current ratio is an indication that cash utilization is not optimal.
Quick Ratio
= [(Cash + Temporary Investments + Accounts Receivable) – Current Liabilities] : 1
= [(2,100 + 100 + 10,000 + 40,500) + 61,000] : 1
= [52,700 + 61,000] : 1
= 0.86 : 1
This ratio is like the current ratio, the difference being the exclusion of inventory, supplies and prepaid expenses. It shows the relationship between assets that can be converted to cash as against amount of current liabilities.
Ratio Analysis notes:
Also called the acid test ratio, the quick ratio measures the company’s liquidity using its most liquid assets, which include cash, stocks, bonds and accounts receivable (all current assets except inventory) and dividing them by current liabilities. This ratio answers the question: Can the business meet its obligations even in adverse conditions? A good benchmark for the quick ratio is between 0.50 and 1 so long as collection of receivables is steady.
Debt to Equity Ratio:
= (Total liabilities + total equity) : 1
= (481000 + 289000) : 1
= 1.66 : 1
This reveals the proportion of a company’s assets from its creditors versus the owner’s or stockholder’s equity. In the balance sheet example, creditors have supplied 1.66 for every 1.00 from the stockholders.
Ratio Analysis notes:
The debt equity ratio is also called the leverage ratio and measures the business’s solvency. It measures the company’s dependency on debt financing vis-à-vis owner’s equity. In layman terms, it shows how much of the business is owed and how much is owned.
To summarize, the current ratio, quick ratio and working capital are indicators of a company’s liquidity and so, the higher these ratios, the better.
Closing thoughts on Balance Sheets
As balance sheets represent a company’s health at a specific point in time, managers must constantly monitor and evaluate the company’s progress and compare it to the past.
After all, information is power and the information obtained from preparing and analysing the balance sheet is invaluable and equip the company with a powerful management tool that can make the difference between success and failure.
Found this lesson useful? Check out our online Mini MBA certificate course to learn other crucial finance concepts, as well as the wider range of business topics.