Average SAT scores for top universities
Average SAT scores distribution, percentile, old-to-new SAT score conversion table
SAT is a well-known test, in the United States, for students in their grades 11 and 12. It is one of the two widely accepted, ACT being the other, standardized tests that help colleges, teachers, parents, and students alike, to check their college readiness.
Given the vastness of various means and resources afforded at different parts of the country, let alone the possibilities of international undergraduate applicants, the SAT test helps to verify how equipped the students are at following the path of advanced higher education, in a university system.
The main SAT exam tests for Math and reading/writing comprehension in the Evidence Based Reading Writing (EBRW/ERW). Up until 2016, SAT followed an old pattern which was disregarded for the new, more relevant to the level of high-school education normally imparted. The new SAT is also claimed to be closer to its competitor, the ACT exam.
Read,
–SAT Exam Syllabus: General Test Pattern
–ACT Exam
Currently, SAT statistics show that as many as over 1.7 million test-takers appear for the exam, annually. Universities use their scores along with a medley of other parameters like the GPA, class rank, extra-curricular activities, and more, in a consolidated holistic admission process. However, given its standardized nature, it seems quite obvious that the SAT/ACT scores do play a mighty important role, nevertheless.
In this article, we will talk about the Average SAT Score, as obtained from the undergraduate admission statistics (2023-2024) of some of the top universities in USA (though some did relax the SAT test requirement during the Covid pandemic). . The university list has been borrowed from the QS World University Rankings. We will also take a quick look at the average SAT performance among the various test-takers in recent years. For completeness sake, we have also included the conversion table for SAT old (prior to 2016) and new scores for those old timers who want to compare their previous performances with the recent scoring system
Average SAT Scores for Undergraduate Admission at Top Universities
| University | Average SAT Scores (25th to 75th Percentiles) |
|---|---|
| MIT |
|
| Stanford University |
|
| Harvard University |
|
| Caltech (moratorium on SAT requirement in recent years) |
|
| University of Chicago |
|
| University of Pennsylvania |
|
| Princeton University |
|
| Yale University |
|
| Cornell University |
|
| Columbia University | SAT Middle 50%: 1490-1560 Historic:
|
| Johns Hopkins University | SAT Middle 50%: 1520-1560 Historic:
|
| University of Michigan Ann Arbor | Median range 1440 – 1540 Historic:
|
| University of California at Berkeley |
|
| Northwestern University | Middle 50%: 1460-1540 Historic:
|
| New York University | Middle 50%: 1350-1530 Historic:
|
| University of California Los Angeles (UCLA) | International admits 25th to 75th percentile: 1480-1550 Historic:
|
| Duke University | Middle 50%: 1510-1570 Historic:
|
| Carnegie Mellon University |
|
| University of California San Diego (UCSD) |
|
| Brown University | Middle 50%: 1500-1570 |
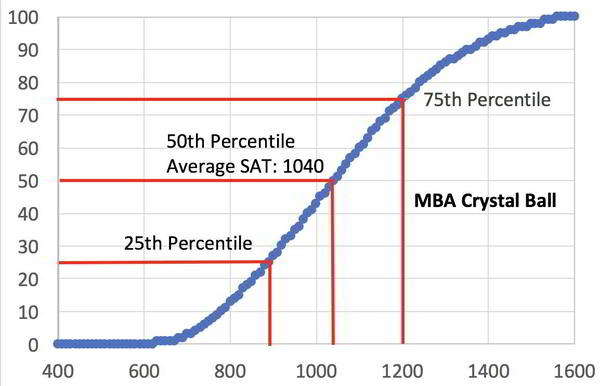
SAT Score Distribution
Based on a report published by College Board, for performance highlights on the 2022 SAT Exams, more than 1.7 million students took the SAT. Despite the relaxed college requirements due to the Covid pandemic, the number of test takers actually went up from 1.5 million in 2021. More than 80% of them were able to send their scores for college applications with 43% of the test takers exceeding the ERW and Math college readiness benchmarks in the test.
Here is a distribution of the various scores, based on the performance of these 2022 test-takers.
SAT Scores Percentiles
SAT Scores Old to New Conversion Table
Though no longer relevant, since its change from old SAT format to the new one since 2016, we have still included the old to new score conversion table below for those who like to see how the two scoring systems compare. This was obtained from College Board Concordance Tables providing a quick and easy comparison. The old scores were out of 2400.
The tables below show a section wise comparison – Old SAT Math and Reading & Writing Mapped to the New SAT Math and EBRW.
| Old SAT Math Section (200-800) | New SAT Math Section | Old SAT Writing plus Critical Reading Sections (400-1000) | New SAT EBRW Section | Old SAT Writing plus Critical Reading Sections (1010-1600) | New SAT EBRW Section |
|---|---|---|---|---|---|
| 200 | 200 | 400 | 200 | 1010 | 560 |
| 210 | 220 | 410 | 210 | 1020 | 570 |
| 220 | 230 | 420 | 220 | 1030 | 570 |
| 230 | 250 | 430 | 230 | 1040 | 580 |
| 240 | 260 | 440 | 240 | 1050 | 580 |
| 250 | 280 | 450 | 260 | 1060 | 590 |
| 260 | 300 | 460 | 270 | 1070 | 590 |
| 270 | 310 | 470 | 280 | 1080 | 600 |
| 280 | 330 | 480 | 290 | 1090 | 600 |
| 290 | 340 | 490 | 300 | 1100 | 610 |
| 300 | 350 | 500 | 310 | 1110 | 610 |
| 310 | 360 | 510 | 310 | 1120 | 620 |
| 320 | 360 | 520 | 320 | 1130 | 620 |
| 330 | 370 | 530 | 320 | 1140 | 630 |
| 340 | 380 | 540 | 330 | 1150 | 630 |
| 350 | 390 | 550 | 330 | 1160 | 640 |
| 360 | 400 | 560 | 330 | 1170 | 640 |
| 370 | 410 | 570 | 340 | 1180 | 650 |
| 380 | 420 | 580 | 340 | 1190 | 650 |
| 390 | 430 | 590 | 350 | 1200 | 650 |
| 400 | 440 | 600 | 350 | 1210 | 660 |
| 410 | 450 | 610 | 360 | 1220 | 660 |
| 420 | 460 | 620 | 360 | 1230 | 670 |
| 430 | 470 | 630 | 360 | 1240 | 670 |
| 440 | 480 | 640 | 370 | 1250 | 680 |
| 450 | 490 | 650 | 370 | 1260 | 680 |
| 460 | 500 | 660 | 380 | 1270 | 680 |
| 470 | 510 | 670 | 380 | 1280 | 690 |
| 480 | 510 | 680 | 390 | 1290 | 690 |
| 490 | 520 | 690 | 390 | 1300 | 700 |
| 500 | 530 | 700 | 400 | 1310 | 700 |
| 510 | 540 | 710 | 400 | 1320 | 700 |
| 520 | 550 | 720 | 410 | 1330 | 710 |
| 530 | 560 | 730 | 410 | 1340 | 710 |
| 540 | 570 | 740 | 420 | 1350 | 710 |
| 550 | 570 | 750 | 420 | 1360 | 720 |
| 560 | 580 | 760 | 430 | 1370 | 720 |
| 570 | 590 | 770 | 430 | 1380 | 730 |
| 580 | 600 | 780 | 440 | 1390 | 730 |
| 590 | 610 | 790 | 440 | 1400 | 730 |
| 600 | 620 | 800 | 450 | 1410 | 740 |
| 610 | 630 | 810 | 450 | 1420 | 740 |
| 620 | 640 | 820 | 460 | 1430 | 740 |
| 630 | 650 | 830 | 460 | 1440 | 750 |
| 640 | 660 | 840 | 470 | 1450 | 750 |
| 650 | 670 | 850 | 480 | 1460 | 750 |
| 660 | 690 | 860 | 480 | 1470 | 760 |
| 670 | 700 | 870 | 490 | 1480 | 760 |
| 680 | 710 | 880 | 490 | 1490 | 760 |
| 690 | 720 | 890 | 500 | 1500 | 770 |
| 700 | 730 | 900 | 500 | 1510 | 770 |
| 710 | 740 | 910 | 510 | 1520 | 770 |
| 720 | 750 | 920 | 510 | 1530 | 780 |
| 730 | 760 | 930 | 520 | 1540 | 780 |
| 740 | 760 | 940 | 530 | 1550 | 780 |
| 750 | 770 | 950 | 530 | 1560 | 790 |
| 760 | 780 | 960 | 540 | 1570 | 790 |
| 770 | 780 | 970 | 540 | 1580 | 800 |
| 780 | 790 | 980 | 550 | 1590 | 800 |
| 790 | 800 | 990 | 550 | 1600 | 800 |
| 800 | 800 | 1000 | 560 |
That concludes the discussion on SAT scores – What do the top universities expect? What is the distribution, including the average SAT score, among all the test-takers? And finally, how will you be able to map the old SAT to the new SAT scores.
Good Luck with your venture into college readiness.
Also read,
–SAT Exam Preparation
–SAT General Information – Eligibility, pattern, exam dates, test centers in India
–Best SAT Preparation Books
Sources:1,2,3,4,5,6,7,8,9,10,11,12,13,14,15,16,17,18,19,20,21